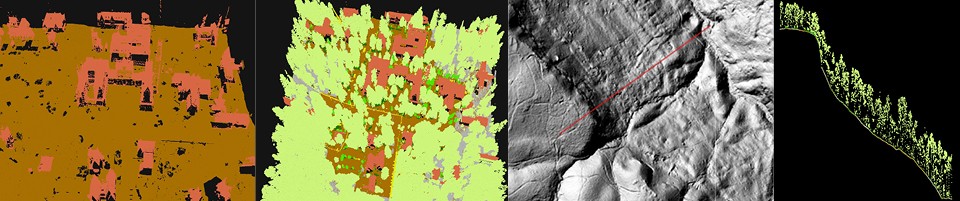
Just a few interpretations of the LiDAR data (left to right): A three-dimensional “point cloud” image of central campus with vegetation not represented; another image of central campus showing vegetation (green), buildings (reddish-brown) and ground (gray and darker brown); a line on a hillshade image of Shakerag Hollow shows where the following cross-section was taken from; and a cross-section down the slope of Shakerag Hollow.
Picturing the Domain
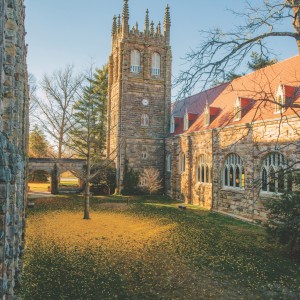
A LiDAR imaging project provides the most detailed topographical maps of the University’s landholdings ever created, and an invaluable research tool for students and faculty in disciplines from forestry and geology to history and archaeology.
BY DAVID B. COE
S ara Smith, C’15, is set to complete the last of her course work as a Sewanee undergrad in four days. Exams loom. She has holiday travel plans to deal with. Oh, and she has 1.2 million trees to catalog.
Smith has been sifting through data from a LiDAR imaging project that was conducted on the Domain early in spring 2015. LiDAR, an acronym for Light Detection and Ranging (some say the term is actually a linguistic mashup of “light” and “radar”) is a laser-based sensory technology used to render highly detailed contour maps.
Pulses of light originate from a device the size of a professional camera that has been mounted to the underside of an aircraft. These pulses rebound off surfaces on the ground and return to the LiDAR device, which records the results. Some of those laser pulses bounce back off of trees, buildings, or brush; others penetrate all the way to the ground. Once the raw data has been collected, it falls to technicians like Smith to interpret what the LiDAR has seen.
Sifting through the data can mean going out in the field to make a physical count of trees on the ground—working in plots 20 meters wide by 50 meters long—as a way of gauging the accuracy of the imaging and interpretive software. At other times, it can mean separating data noise from actual results. As Smith puts it, tongue firmly in cheek, “I spent one fascinating weekend deleting power lines and poles from the images.” But ultimately the LiDAR data also enable her to “quantify the biomass and stored carbon” of the Domain’s forests through calculations that rely on the number of trees, their height, and the spread of their canopies.
Much of Smith’s research is done in Sewanee’s Landscape Analysis Lab (LAL), under the supervision of Chris Van de Ven, geographic information systems (GIS) instructor and LAL manager. Van de Ven has been working with Sewanee’s LiDAR data since it arrived in mid-April. Using different software applications, he turns speckled images that resemble color-blindness tests into “hillshades” (detailed representations of the terrain), creates three-dimensional renderings of the campus, complete with buildings and trees, and generates some of the most precise topographical maps of the Domain ever made.
According to Van de Ven, the LiDAR project is furthering the University’s goal of using the Domain as a classroom. Information gleaned from the data is already proving to be of use to students of forestry, archaeology, ecology, and other disciplines. It is even sought by architects working on Sewanee’s downtown development project. Smith’s research, and the utility of the LiDAR technology, has also drawn the notice of other University faculty. Professor of Forestry Scott Torreano offered advice and steered her to scientific papers relevant to her work, and Professor of Biology Deborah McGrath used Smith’s contours of the Sewanee Utility District’s constructed wetland site for another ecology project.
To make the raw data more digestible, the LiDAR image of the Domain’s 13,000 acres has been divided into over 570 squares. These squares are then analyzed and rendered in various ways. How detailed is the information? Before LiDAR, the most accurate maps of Sewanee available to scholars at the University were detailed down to units of 10 square meters. With LiDAR, Van de Ven and others are working with images generated from as many as 20 points of light aimed at every single square meter. “If there’s a bump on the ground that’s two inches high, we’ll see it,” says Van de Ven. “The trick is figuring out what that bump is.”
“The difference between the ground images we had before and what we have now is exponential,” says Kevin Hiers, C’96, Sewanee’s director of environmental stewardship. Hiers’ office was instrumental in securing for Smith the background she needed to interpret the LiDAR data. Over the summer, with funding from the environmental stewardship program, Smith trained at the University of San Francisco under the supervision of David Saah, a colleague of Hiers who is an expert in geospatial information technology. Hiers hopes to build on this relationship between Sewanee and USF so that other students can gain the skills Smith is currently using.
Hiers, who prior to his arrival in Sewanee had overseen wildfire prevention at U.S. Air Force bases, has long been familiar with LiDAR. But he sees innovation in Sewanee’s use of the technology. “We’re taking an emerging technology, showing students what’s standard in an industry sense, but also using it for academic exploration.” Hiers believes that the technology lends itself to study that transcends traditional departmental boundaries. “We flew the LiDAR project with the intent of it being interdisciplinary,” he says. “Each analytical layer of the LiDAR capture gives a slightly different set of data. It can be very specific to discipline and also very rich.”
Evidence of LiDAR’s cross-disciplinary value can be found in the work of John C. Willis, Jessie Ball duPont Professor of History. Willis, who has been researching the history of land use on the Domain, has used LiDAR imagery to confirm and discover old logging roads, boundaries of abandoned farms, and remnants of dormant coal mines. In particular, Willis has relied on black-and-white hillshade images that reveal the geometric patterns of old crop fields and structural foundations.
“The data is helpful to me, because it shows structures and marks of human habitation and activity that would otherwise be hidden beneath vegetation and leaf litter,” says Willis. By offering insights into mining practices and the “ingeniousness of old field-clearing techniques,” LiDAR allows Willis to see “how landscape affected humans, and how humans shaped their environment.”
Hiers believes the LiDAR project will continue to pay dividends to the University, in research and in the classroom, for years to come. “We’ll be working on carbon analyses of forests for two or three more years; surface study of man-made and geological formations could continue for another decade.”
The images generated by that airplane-mounted laser device will be a part of Sara Smith’s life for the foreseeable future. As a post-baccalaureate fellow in Sewanee’s Environmental Stewardship and Sustainability program, she will be continuing her research in the Landscape Analysis Lab for another year. From there, she is considering going on to graduate school in environment and sustainability, perhaps at the University of San Francisco. For now, though, she has more hillshades to examine, more numbers to crunch, and, of course, more trees to count.